WebGL2 三维几何加工
这可能是一个晦涩的话题,但是我觉得很有趣所以就写出来了。 这些东西并不是建议你要会做的,我只是认为通过这个话题能够让你对制作 WebGL 三维模型有一些理解。
有人问我怎么在 WebGL 中制作一个保龄球瓶,聪明的回答是 “使用一个三维建模工具例如Blender, Maya, 3D Studio Max, Cinema 4D, 等等”。 使用它创建一个保龄球瓶,导出,读取点坐标(OBJ 格式相对简单些)。
但是,这让我想到,如果他们想做一个模型库该怎么办?
这有几种方法,一种方法是将圆柱体按照正弦函数放置在合适位置上, 但这样表面并不平滑。一个标准的圆柱需要一些间距相等的圆环, 但当曲线变得锐利的时候所需圆环的数量就会很多。
在模型库中你需要制作一个二维轮廓或者是一个符合边缘的曲线,然后将他们加工成三维图形。 这里加工的意思就是将生成的二维点按照某些轴旋转。这样就可以很轻松的做出一些圆的物体, 例如碗,棒球棒,瓶子,灯泡之类的物体。
那么该怎么做呢?首先我们要通过某种方式生成一个曲线,计算曲线上的点。 然后使用矩阵运算将这些点按照某个轴旋转, 构建出三角形网格。
计算机中常用的曲线就是贝塞尔曲线,你可能在一些编辑器例如 Adobe Illustrator 或 Inkscape 或 Affinity Designer 中编辑过贝塞尔曲线。
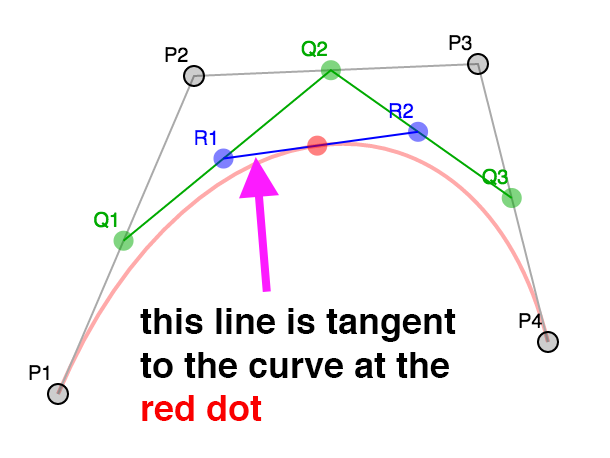
贝塞尔曲线或三次贝塞尔曲线由 4 个点组成,2 个端点,2 个“控制点”。
这就是四个点
从 0 到 1 之间选一个数(叫做 t),其中 0 是起点,1 是终点。
然后在每个线段中计算出与 t 相关的点,P1 P2, P2 P3, P3 P4。
换句话说如果 t = .25 那么就计算出 P1 到 P2 距离为 25% 的点,
从 P2 到 P3 距离为 25% 的点,从 P3 到 P4 距离为 25% 的点。
你可以拖动滑块调整 t 的值,也可以拖动 P1, P2, P3, 和 P4 调整位置。
对这些结果点做同样的操作,计算 t 对应的 Q1 Q2 和 Q2 Q3 之间的点。
最后在 R1 R2 中计算出与 t 相关的点。
红点的位置就构成了一个曲线。
这就是三次贝塞尔曲线。
注意到在上述差值过程中通过 4 个点差出 3 个点,3 个点差出 2 个点,最后从 2 个点差出 1 个点, 这并不是常用的做法,有人将这些数学运算简化成了一个公式,像这样
invT = (1 - t)
P = P1 * invT^3 +
    P2 * 3 * t * invT^2 +
    P3 * 3 * invT * t^2 +
    P4 * t^3
其中 P1, P2, P3, P4 就像上例中的四个点,
P 就是那个 红点。
在二维美术应用例如 Adobe Illustrator 中, 当你制作一个较长的曲线时通常是由一些小的四点片段组成的。 默认情况下应用将控制点沿着起/终点方向锁死, 确保在公共点部分方向相反。
看这个例子。移动 P3 或 P5 会同时移动另一个。
注意这个曲线是两段,P1,P2,P3,P4 和 P4,P5,P6,P7。
只有在 P3,P5 与 P4 的连线方向相反时曲线在这一点才会连续。
大多数应用可以让你断开连接,并获得一个锐利的拐点。
取消选中复选框然后拖拽 P3 或 P5 就会清晰看到独立的曲线。
接下来我们需要获得生成曲线上的点,通过给上方的公式提供 t
就可以生成一个点。
function getPointOnBezierCurve(points, offset, t) {
  const invT = (1 - t);
  return v2.add(v2.mult(points[offset + 0], invT * invT * invT),
                v2.mult(points[offset + 1], 3 * t * invT * invT),
                v2.mult(points[offset + 2], 3 * invT * t * t),
                v2.mult(points[offset + 3], t * t  *t));
}
然后可以计算一系列点。
function getPointsOnBezierCurve(points, offset, numPoints) {
  const points = [];
  for (let i = 0; i < numPoints; ++i) {
    const t = i / (numPoints - 1);
    points.push(getPointOnBezierCurve(points, offset, t));
  }
  return points;
}
注意: v2.mult 和 v2.add 是我加入的二维点运算辅助方法。
在图示中你可以选择点的个数,如果曲线比较锐利就可以多差值一些点, 如果曲线比较平缓就可以少插值一些点。一个解决办法是检查曲线的锐利程度, 如果过于锐利就拆分成两个曲线。
拆分的部分比较简单,如果我们再看看不同级别的查分,对于任意值的 t,
P1, Q1, R1, 红点构成一个曲线,终点是红点。
红点, R2, Q3, P4 构成一个曲线。换句话说我们可以将曲线从任意位置分成两段,
并且和原曲线相同。
第二个部分是如何决定曲线是否需要拆分,从网上查找后我发现了这个方法, 对于给定的曲线可以求出平滑程度。
function flatness(points, offset) {
  const p1 = points[offset + 0];
  const p2 = points[offset + 1];
  const p3 = points[offset + 2];
  const p4 = points[offset + 3];

  let ux = 3 * p2[0] - 2 * p1[0] - p4[0]; ux *= ux;
  let uy = 3 * p2[1] - 2 * p1[1] - p4[1]; uy *= uy;
  let vx = 3 * p3[0] - 2 * p4[0] - p1[0]; vx *= vx;
  let vy = 3 * p3[1] - 2 * p4[1] - p1[1]; vy *= vy;

  if(ux < vx) {
    ux = vx;
  }

  if(uy < vy) {
    uy = vy;
  }

  return ux + uy;
}
我们可以用它获取曲线上的点,首先检查曲线是否太锐利,如果是就拆分, 不是就将点加入列表。
function getPointsOnBezierCurveWithSplitting(points, offset, tolerance, newPoints) {
  const outPoints = newPoints || [];
  if (flatness(points, offset) < tolerance) {

    // 将它加入点队列中
    outPoints.push(points[offset + 0]);
    outPoints.push(points[offset + 3]);

  } else {

    // 拆分
    const t = .5;
    const p1 = points[offset + 0];
    const p2 = points[offset + 1];
    const p3 = points[offset + 2];
    const p4 = points[offset + 3];

    const q1 = v2.lerp(p1, p2, t);
    const q2 = v2.lerp(p2, p3, t);
    const q3 = v2.lerp(p3, p4, t);

    const r1 = v2.lerp(q1, q2, t);
    const r2 = v2.lerp(q2, q3, t);

    const red = v2.lerp(r1, r2, t);

    // 求前半段的点
    getPointsOnBezierCurveWithSplitting([p1, q1, r1, red], 0, tolerance, outPoints);
    // 求后半段的点
    getPointsOnBezierCurveWithSplitting([red, r2, q3, p4], 0, tolerance, outPoints);

  }
  return outPoints;
}
这个算法在获取曲线点的过程中确保了点的数量比较充足,但是不能很好的排除不必要的点。
由于这个原因我们将使用我在网上找到的 Ramer Douglas Peucker 算法。
在这个算法中我们提供一系列点,找到离最后两点构成的直线距离最远的点, 然后将这个距离和一个定值进行比较,如果小于那个值就保留最后两个点然后丢弃其他的点, 大于则将曲线沿那个最远点分成两份,分别对每一份再做一次这个运算。
function simplifyPoints(points, start, end, epsilon, newPoints) {
  const outPoints = newPoints || [];

  // 找到离最后两点距离最远的点
  const s = points[start];
  const e = points[end - 1];
  let maxDistSq = 0;
  let maxNdx = 1;
  for (let i = start + 1; i < end - 1; ++i) {
    const distSq = v2.distanceToSegmentSq(points[i], s, e);
    if (distSq > maxDistSq) {
      maxDistSq = distSq;
      maxNdx = i;
    }
  }

  // 如果距离太远
  if (Math.sqrt(maxDistSq) > epsilon) {

    // 拆分
    simplifyPoints(points, start, maxNdx + 1, epsilon, outPoints);
    simplifyPoints(points, maxNdx, end, epsilon, outPoints);

  } else {

    // 添加最后两个点
    outPoints.push(s, e);
  }

  return outPoints;
}
v2.distanceToSegmentSq 是计算点到线段距离平方的一个方法,
使用距离平方的原因是比使用实际距离要快一些,因为我们值管线最远距离所以和实际距离的效果相同。
这是结果,调整距离查看添加或删除的点。
回到保龄球瓶,我们可以将上方的代码整理一下,需要添加和移除点,锁定和解锁控制点, 撤销等等。但是这有一个简单的方式,我们可以使用一个上方提到的编辑器,我使用这个在线编辑器。
这是我做的保龄球的半边轮廓的 svg。

由 4 个曲线制成,路径的数据像这样
<path fill="none" stroke-width="5" d="
   m44,434
   c18,-33 19,-66 15,-111
   c-4,-45 -37,-104 -39,-132
   c-2,-28 11,-51 16,-81
   c5,-30 3,-63 -36,-63
"/>
解译这些数据 得到这些点。
        ___
44, 371,   |
62, 338,   | 第一个曲线
63, 305,___|__
59, 260,___|  |
55, 215,      | 第二个曲线
22, 156,______|__
20, 128,______|  |
18, 100,         | 第三个曲线
31,  77,_________|__
36,  47,_________|  |
41,  17,            | 第四个曲线
39, -16,            |
 0, -16,____________|
现在有了曲线数据,需要计算出曲线上的点。
// 获取所有片段的点
function getPointsOnBezierCurves(points, tolerance) {
  const newPoints = [];
  const numSegments = (points.length - 1) / 3;
  for (let i = 0; i < numSegments; ++i) {
    const offset = i * 3;
    getPointsOnBezierCurveWithSplitting(points, offset, tolerance, newPoints);
  }
  return newPoints;
}
调用 simplifyPoints 处理结果。
现在要旋转它们了,需要决定分多少个部分,对于每个部分都用矩阵运算 绕 Y 轴转动一定角度获得,一旦获得所有点就用索引连接它们。
// 绕 Y 轴旋转
function lathePoints(points,
                     startAngle,   // 起始角 (例如 0)
                     endAngle,     // 终止角 (例如 Math.PI * 2)
                     numDivisions, // 这中间生成多少块
                     capStart,     // true 就封闭起点
                     capEnd) {     // true 就封闭重点
  const positions = [];
  const texcoords = [];
  const indices = [];

  const vOffset = capStart ? 1 : 0;
  const pointsPerColumn = points.length + vOffset + (capEnd ? 1 : 0);
  const quadsDown = pointsPerColumn - 1;

  // 生成点
  for (let division = 0; division <= numDivisions; ++division) {
    const u = division / numDivisions;
    const angle = lerp(startAngle, endAngle, u) % (Math.PI * 2);
    const mat = m4.yRotation(angle);
    if (capStart) {
      // 在开始处添加一个 Y 轴上的点
      positions.push(0, points[0][1], 0);
      texcoords.push(u, 0);
    }
    points.forEach((p, ndx) => {
      const tp = m4.transformPoint(mat, [...p, 0]);
      positions.push(tp[0], tp[1], tp[2]);
      const v = (ndx + vOffset) / quadsDown;
      texcoords.push(u, v);
    });
    if (capEnd) {
      // 在终点处添加一个 Y 轴上的点
      positions.push(0, points[points.length - 1][1], 0);
      texcoords.push(u, 1);
    }
  }

  // 创建索引
  for (let division = 0; division < numDivisions; ++division) {
    const column1Offset = division * pointsPerColumn;
    const column2Offset = column1Offset + pointsPerColumn;
    for (let quad = 0; quad < quadsDown; ++quad) {
      indices.push(column1Offset + quad, column2Offset + quad, column1Offset + quad + 1);
      indices.push(column1Offset + quad + 1, column2Offset + quad, column2Offset + quad + 1);
    }
  }

  return {
    position: positions,
    texcoord: texcoords,
    indices: indices,
  };
}
上方的代码创建了位置点和纹理坐标,然后创建索引生成三角网。
capStart 和 capEnd 确定是都生成闭合点,假设我们在做一个罐头,
这些选项指明是否需要闭合顶面和底面。
使用我们的 简化代码 就可以用哪些数据生成这样的 WebGL 缓冲
const tolerance = 0.15;
const distance = .4;
const divisions = 16;
const startAngle = 0;
const endAngle = Math.PI * 2;
const capStart = true;
const capEnd = true;

const tempPoints = getPointsOnBezierCurves(curvePoints, tolerance);
const points = simplifyPoints(tempPoints, 0, tempPoints.length, distance);
const arrays = lathePoints(points, startAngle, endAngle, divisions, capStart, capEnd);
const extents = getExtents(arrays.position);
if (!bufferInfo) {
  bufferInfo = webglUtils.createBufferInfoFromArrays(gl, arrays);
这是结果
拖动滑块观察对结果的影响。
这还有一个问题,开启三角形你会看到纹理不是均匀分布的,这是因为我们将纹理坐标的 v
值赋为曲线点的索引,如果曲线上的点距离相等那就没问题,但是它们距离并不相等。
我们可以遍历曲线上的点并计算出每一点对应曲线长度,最后将这个长度除以曲线总长度赋值给 v。
// 绕 Y 轴旋转
function lathePoints(points,
                     startAngle,   // 起始角 (例如 0)
                     endAngle,     // 终止角 (例如 Math.PI * 2)
                     numDivisions, // 这中间生成多少块
                     capStart,     // true 就封闭起点
                     capEnd) {     // true 就封闭重点
  const positions = [];
  const texcoords = [];
  const indices = [];

  const vOffset = capStart ? 1 : 0;
  const pointsPerColumn = points.length + vOffset + (capEnd ? 1 : 0);
  const quadsDown = pointsPerColumn - 1;

+  // 生成 v 值
+  let vcoords = [];
+
+  // 先计算出每一点对应的长度
+  let length = 0;
+  for (let i = 0; i < points.length - 1; ++i) {
+    vcoords.push(length);
+    length += v2.distance(points[i], points[i + 1]);
+  }
+  vcoords.push(length);  // 最后一个点
+
+  // 除以总长
+  vcoords = vcoords.map(v => v / length);

  // 生成点
  for (let division = 0; division <= numDivisions; ++division) {
    const u = division / numDivisions;
    const angle = lerp(startAngle, endAngle, u) % (Math.PI * 2);
    const mat = m4.yRotation(angle);
    if (capStart) {
      // 在开始处添加一个 Y 轴上的点
      positions.push(0, points[0][1], 0);
      texcoords.push(u, 0);
    }
    points.forEach((p, ndx) => {
      const tp = m4.transformPoint(mat, [...p, 0]);
      positions.push(tp[0], tp[1], tp[2]);
*      texcoords.push(u, vcoords[ndx]);
    });
    if (capEnd) {
      // 在终点处添加一个 Y 轴上的点
      positions.push(0, points[points.length - 1][1], 0);
      texcoords.push(u, 1);
    }
  }

  // 创建索引
  for (let division = 0; division < numDivisions; ++division) {
    const column1Offset = division * pointsPerColumn;
    const column2Offset = column1Offset + pointsPerColumn;
    for (let quad = 0; quad < quadsDown; ++quad) {
      indices.push(column1Offset + quad, column1Offset + quad + 1, column2Offset + quad);
      indices.push(column1Offset + quad + 1, column2Offset + quad + 1, column2Offset + quad);
    }
  }

  return {
    position: positions,
    texcoord: texcoords,
    indices: indices,
  };
}
这是结果
这些纹理坐标还是不完美,因为我们还没决定怎么处理闭合部分的纹理。这也是使用建模软件的一个原因。 我们可以总结出很多计算闭合处 uv 值的方法,但并不是很有意义。 如果你 谷歌一下 UV map a barrel, 你会发现完美的 UV 坐标是不需要太多数学运算的,只需要生成合适的点数据,这时你就需要一个合适工具创建点数据。
还有一个事情要做,就是添加法向量。
我们可以计算每一个曲线点的法向量,事实上如果你会看这节中的例子,你会发现 R1 和 R2
构成的线段切曲线于红点处。
法向量和切线垂直所以从切线很容易求出法向量。
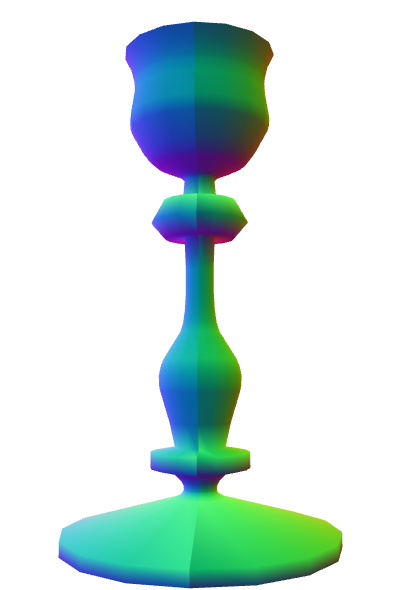
但是,假设我们想要做一个烛台,有这样一个框架。

这有很多平滑区域也有很多锐利角,如何决定使用法向量的方向呢?当需要锐利边缘时就要使用多余的顶点, 因为一个顶点有一个位置和一个法向量,如果需要多个法向量就需要不同的顶点,这也是制作立方体需要至少 24 个顶点的原因,虽然立方体只有 8 个顶点,但每个面在那个顶点处都需要不同的法向量。
创建立方体的时候很容易确定法向量,但是形状复杂的时候就没那么容易了。
所有的建模软件都有不同的方式创建法向量,一个常用的做法就是将该点邻接的三角面的法向量求平均。 另外,还允许用户选择一个最大角度,如果邻接的多边形的法向量的夹角大于最大角度,就会创建一个新顶点。
我们来实现这个。
function generateNormals(arrays, maxAngle) {
  const positions = arrays.position;
  const texcoords = arrays.texcoord;

  // 首先计算出每个面的法向量
  let getNextIndex = makeIndiceIterator(arrays);
  const numFaceVerts = getNextIndex.numElements;
  const numVerts = arrays.position.length;
  const numFaces = numFaceVerts / 3;
  const faceNormals = [];

  // 计算每个面的法向量,
  // 计算过程中为每个面新建顶点
  for (let i = 0; i < numFaces; ++i) {
    const n1 = getNextIndex() * 3;
    const n2 = getNextIndex() * 3;
    const n3 = getNextIndex() * 3;

    const v1 = positions.slice(n1, n1 + 3);
    const v2 = positions.slice(n2, n2 + 3);
    const v3 = positions.slice(n3, n3 + 3);

    faceNormals.push(m4.normalize(m4.cross(m4.subtractVectors(v1, v2), m4.subtractVectors(v3, v2))));
  }

  let tempVerts = {};
  let tempVertNdx = 0;

  // 假设顶点位置精确匹配

  function getVertIndex(x, y, z) {

    const vertId = x + "," + y + "," + z;
    const ndx = tempVerts[vertId];
    if (ndx !== undefined) {
      return ndx;
    }
    const newNdx = tempVertNdx++;
    tempVerts[vertId] = newNdx;
    return newNdx;
  }

  // 我们需要算出共享的顶点
  // 这并不像我们看着面那么简单 (三角形)
  // 因为加入我们有一个标准的圆柱
  //
  //
  //      3-4
  //     /   \
  //    2     5   从上往下看,从 S 走到 E, E 和 S
  //    1     6   是不同的点,因为它们不共享UV坐标。
  //     \   /
  //      S/E
  //
  // 顶点在其实和结束位置并不是共享的
  // 由于它们有不同的UV坐标,但如果不
  // 把它们看作共享顶点就会得到错误结果

  const vertIndices = [];
  for (let i = 0; i < numVerts; ++i) {
    const offset = i * 3;
    const vert = positions.slice(offset, offset + 3);
    vertIndices.push(getVertIndex(vert));
  }

  // 遍历所有顶点记录所在的面
  const vertFaces = [];
  getNextIndex.reset();
  for (let i = 0; i < numFaces; ++i) {
    for (let j = 0; j < 3; ++j) {
      const ndx = getNextIndex();
      const sharedNdx = vertIndices[ndx];
      let faces = vertFaces[sharedNdx];
      if (!faces) {
        faces = [];
        vertFaces[sharedNdx] = faces;
      }
      faces.push(i);
    }
  }

  // 遍历面上的顶点计算每个顶点的法向量
  // 只计算两面角度不大于 maxAngle 面
  // 将结果写入 newPositions,
  // newTexcoords 和 newNormals,
  // 丢弃相同的顶点
  tempVerts = {};
  tempVertNdx = 0;
  const newPositions = [];
  const newTexcoords = [];
  const newNormals = [];

  function getNewVertIndex(x, y, z, nx, ny, nz, u, v) {
    const vertId =
        x + "," + y + "," + z + "," +
        nx + "," + ny + "," + nz + "," +
        u + "," + v;

    const ndx = tempVerts[vertId];
    if (ndx !== undefined) {
      return ndx;
    }
    const newNdx = tempVertNdx++;
    tempVerts[vertId] = newNdx;
    newPositions.push(x, y, z);
    newNormals.push(nx, ny, nz);
    newTexcoords.push(u, v);
    return newNdx;
  }

  const newVertIndices = [];
  getNextIndex.reset();
  const maxAngleCos = Math.cos(maxAngle);
  // 对每个面
  for (let i = 0; i < numFaces; ++i) {
    // 获取该面的法向量
    const thisFaceNormal = faceNormals[i];
    // 对于面上的每一点
    for (let j = 0; j < 3; ++j) {
      const ndx = getNextIndex();
      const sharedNdx = vertIndices[ndx];
      const faces = vertFaces[sharedNdx];
      const norm = [0, 0, 0];
      faces.forEach(faceNdx => {
        // 面的法向量是否相同
        const otherFaceNormal = faceNormals[faceNdx];
        const dot = m4.dot(thisFaceNormal, otherFaceNormal);
        if (dot > maxAngleCos) {
          m4.addVectors(norm, otherFaceNormal, norm);
        }
      });
      m4.normalize(norm, norm);
      const poffset = ndx * 3;
      const toffset = ndx * 2;
      newVertIndices.push(getNewVertIndex(
          positions[poffset + 0], positions[poffset + 1], positions[poffset + 2],
          norm[0], norm[1], norm[2],
          texcoords[toffset + 0], texcoords[toffset + 1]));
    }
  }

  return {
    position: newPositions,
    texcoord: newTexcoords,
    normal: newNormals,
    indices: newVertIndices,
  };

}

function makeIndexedIndicesFn(arrays) {
  const indices = arrays.indices;
  let ndx = 0;
  const fn = function() {
    return indices[ndx++];
  };
  fn.reset = function() {
    ndx = 0;
  };
  fn.numElements = indices.length;
  return fn;
}

function makeUnindexedIndicesFn(arrays) {
  let ndx = 0;
  const fn = function() {
    return ndx++;
  };
  fn.reset = function() {
    ndx = 0;
  }
  fn.numElements = arrays.positions.length / 3;
  return fn;
}

function makeIndiceIterator(arrays) {
  return arrays.indices
      ? makeIndexedIndicesFn(arrays)
      : makeUnindexedIndicesFn(arrays);
}
上方的代码首先通过原始顶点计算每个面(三角形)的法向量, 然后创建一个顶点索引集寻找相同的顶点,那是因为我们旋转后的起始和终止点应该是同一个点, 但 UV 坐标不同所以要单独处理,计算顶点法向量时要将它们看作相同点。
这些做完之后,对于每个顶点,生成了一个包含它的面的集合。
最后将所有除了差值大于 maxAngle 的面的法向量求平均,获得一个新的顶点集合。
这是结果
注意到在期望的位置得到了锐利的边缘,调大 maxAngle 的值就会将相邻的面加入计算,得到平滑的边缘。
试试调整 divisions 为 5 或者 6 然后调整 maxAngle 的值让该平滑的地方平滑,该锐利的地方锐利,
你也可以设置 mode 为 lit 查看光照效果,这是我们需要法向量的原因。
那么,我们学到了什么呢?
我们学到了如果想做三维模型就用三维建模库😝
你可能需要以个 UV 编辑器, 帮助完成封闭问题也是三维编辑器提供的功能。代替使用有限的组合处理闭合处问题, 可以使用其他编辑器提供的特性处理闭合处并轻松的获取 UV 值,三维编辑器还支持 拉伸面和 沿路径拉伸, 你看了之后就会发现它们基于上方的加工方式。
参考
如果没有这篇出色的贝塞尔曲线文章 我就不可能完成这些内容。
这里的模运算符是做什么的?
如果你仔细看了 lathePoints 方法就会看到计算角度时使用了模运算符。
for (let division = 0; division <= numDivisions; ++division) {
  const u = division / numDivisions;
*  const angle = lerp(startAngle, endAngle, u) % (Math.PI * 2);
为什么这么做?
当我们将点旋转成一个圆形时我们希望起点和终点是匹配的。 Math.sin(0) 和
Math.sin(Math.PI * 2) 应该相等,但是浮点运算并不精确,所以通常它们并不是
100% 的相等。
这在计算法向量的时候十分重要,我们想知道到一个顶点共享的所有面,我们比较顶点, 如果相同就认为是同一点,那么如果不被认为是同一点就会计算出错误的法向量。
这是这种情况发生时的样子
你可以看到它们在共享处没有被当作相同点,因为它们不是100%的相等。
起初我想通过提供一个误差范围,检查顶点的距离是否在范围内,如果小于误差范围就认为是同一点。 就像这样。
const epsilon = 0.0001;
const tempVerts = [];
function getVertIndex(position) {
  if (tempVerts.length) {
    // 找到最近的点
    let closestNdx = 0;
    let closestDistSq = v2.distanceSq(position, tempVerts[0]);
    for (let i = 1; i < tempVerts.length; ++i) {
      let distSq = v2.distanceSq(position, tempVerts[i]);
      if (distSq < closestDistSq) {
        closestDistSq = distSq;
        closestNdx = i;
      }
    }
    // 是否在误差范围内
    if (closestDistSq < epsilon) {
      // 是就返回那个点
      return closestNdx;
    }
  }
  // 不是就将它添加到序列中并返回索引
  tempVerts.push(position);
  return tempVerts.length - 1;
}
它成功了,我解决了接缝问题。但是它消耗的时间太长,导致UI交互不稳定。 这是因为它是一个复杂度为 O^2 的解决方法,如果你滑动滑块在最多的情况下就会创建大约 20000 个点, 再加上 O^2 的复杂度就是 3 亿次迭代。
我在网上寻找简单的方法但没找到,我想过将所有点都放到 八叉树 中,让寻找匹配点速度快一些, 但那似乎远离了本章的范围。
然后我就想到既然只是终点问题我就可以进行模运算,让结果相等。原始代码像这样
const angle = lerp(startAngle, endAngle, u);新代码像这样
const angle = lerp(startAngle, endAngle, u) % (Math.PI * 2);
由于模运算 endAngle 为 Math.PI * 2 时 angle 就为 0,和起始点相同,接缝消失了,问题解决了!
但是,即使这样当设置 distance 为 0.001 并且 divisions 为 60 时,在我的机子上还要几乎1 秒钟的运算。这可能还有很多可以优化的地方,但创建复杂的网格是一个耗时的工作,这就是我的三维游戏可以以
60fps 运行,但是三维建模工具通常都是很低的帧率。