WebGL2 Setup and Installation
Techincally you don’t need anything other than a web browser to do WebGL development. Go to jsfiddle.net or jsbin.com or codepen.io and just start applying the lessons here.
On all of them you can reference external scripts by adding a <script src="..."></script>
tag pair if you want to use external scripts.
Still, there are limits. WebGL has stronger restrictions than Canvas2D for loading images which means you can’t easily access images from around the web for your WebGL work. On top of that it’s just faster to work with everything local.
Let’s assume you want to run and edit the samples on this site. The first thing you should do is download the site. You can download it here.
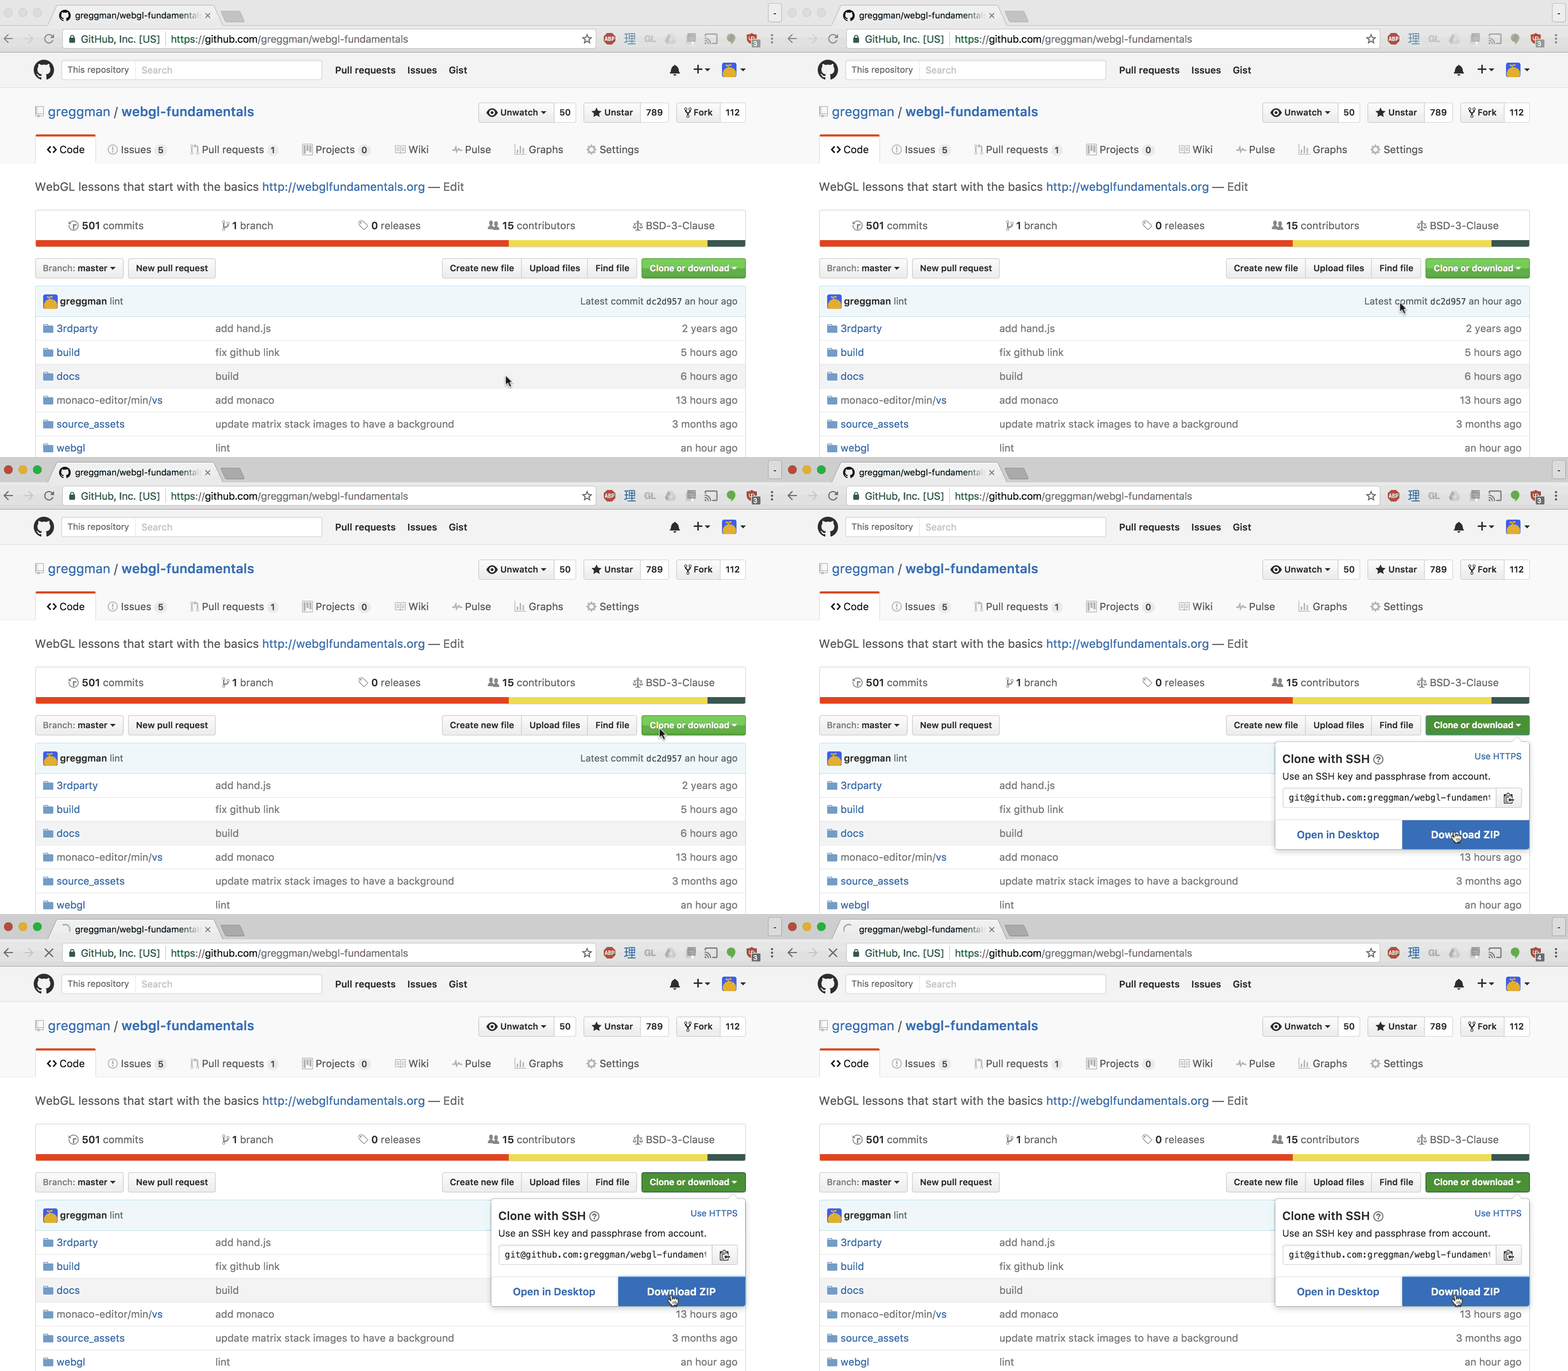
Unzip the files into some folder.
Using a small simple easy Web Server
Next up you should install a small web server. I know “web server” sounds scary but the truth is web servers are actually extremely simple.
Here’s a very simple one with an interface called Servez.
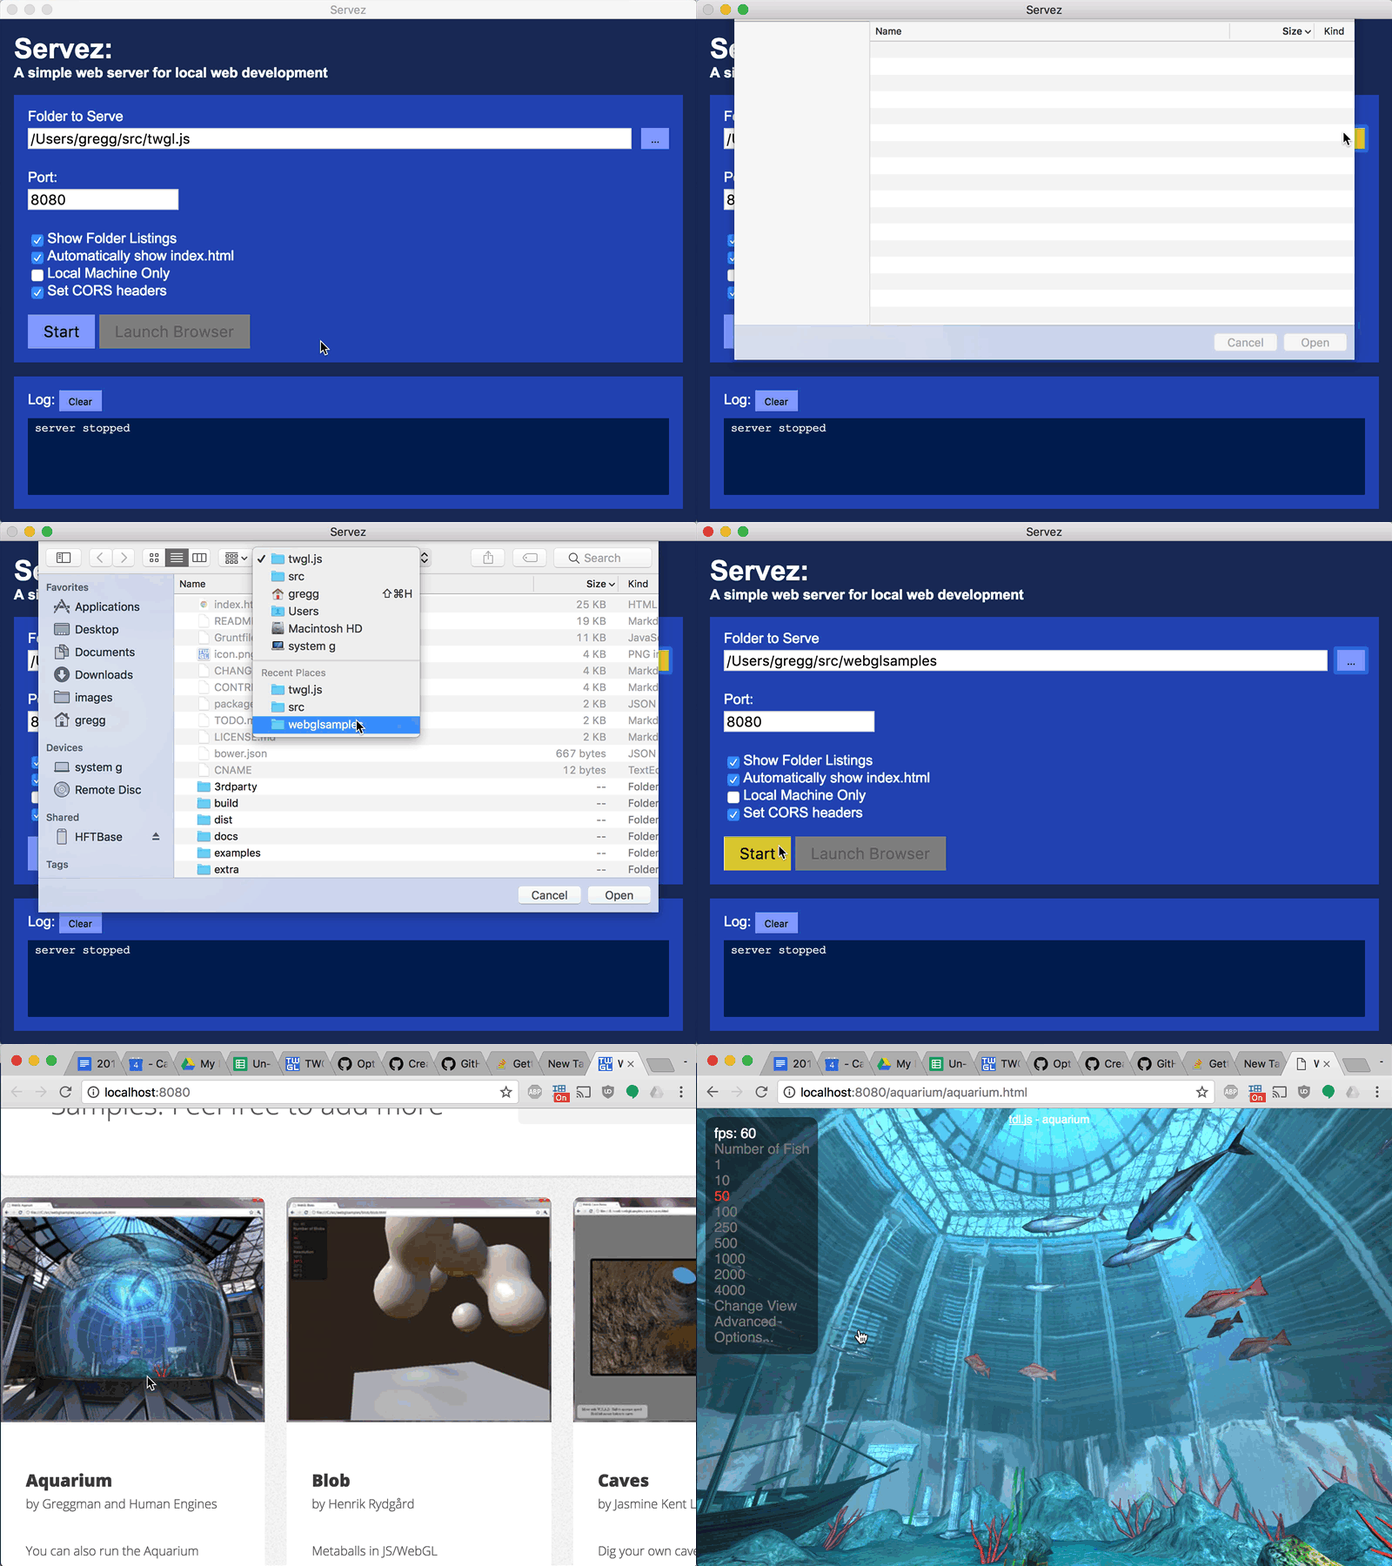
Just point it at the folder where you unzipped the files, click “Start”, then go to
in your browser http://localhost:8080/webgl/`http://localhost:8080/webgl/) and choose
a sample.
If you prefer the command line, another way is to use node.js. Download it, install it, then open a command prompt / console / terminal window. If you’re on Windows the installer will add a special “Node Command Prompt” so use that.
Then install the servez by typing
npm -g install servez
If you’re on OSX use
sudo npm -g install servez
Once you’ve done that type
servez path/to/folder/where/you/unzipped/files
It should print something like

Then in your browser go to http://localhost:8080/webgl/.
If you don’t specify a path then servez will server the current folder.
Using your Browsers Developer Tools
Most browser have extensive developer tools built in.
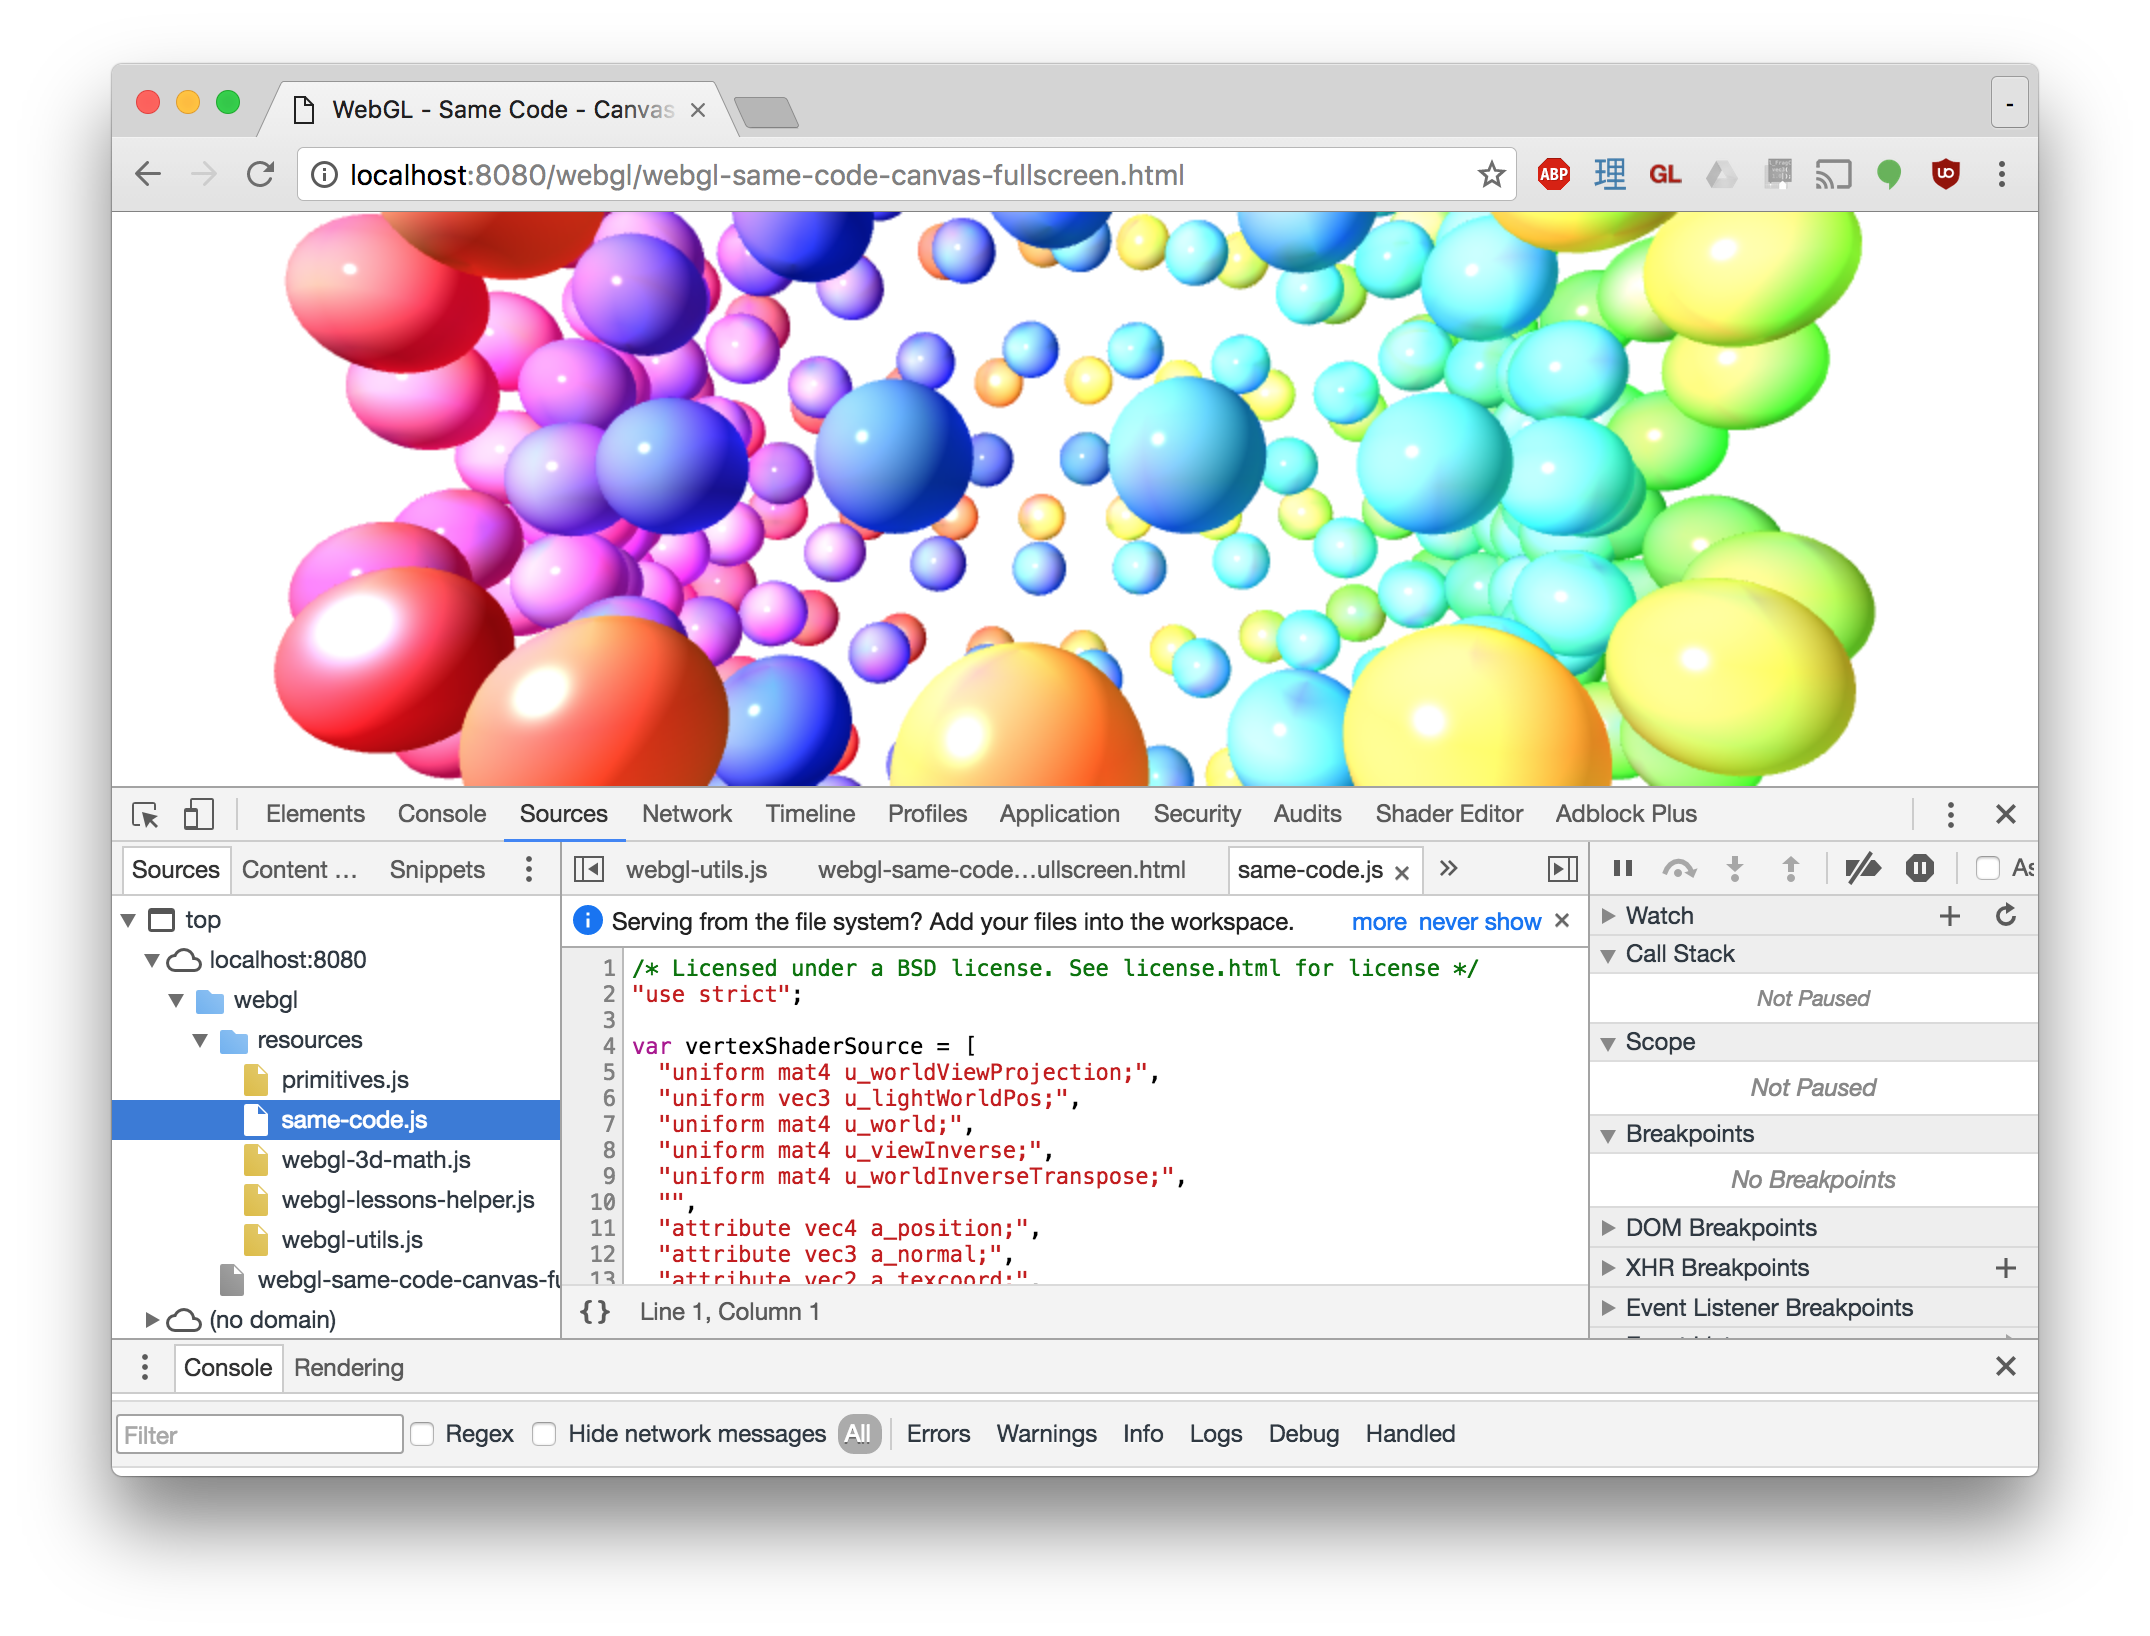
Docs for Chrome’s are here, Firefox’s are here.
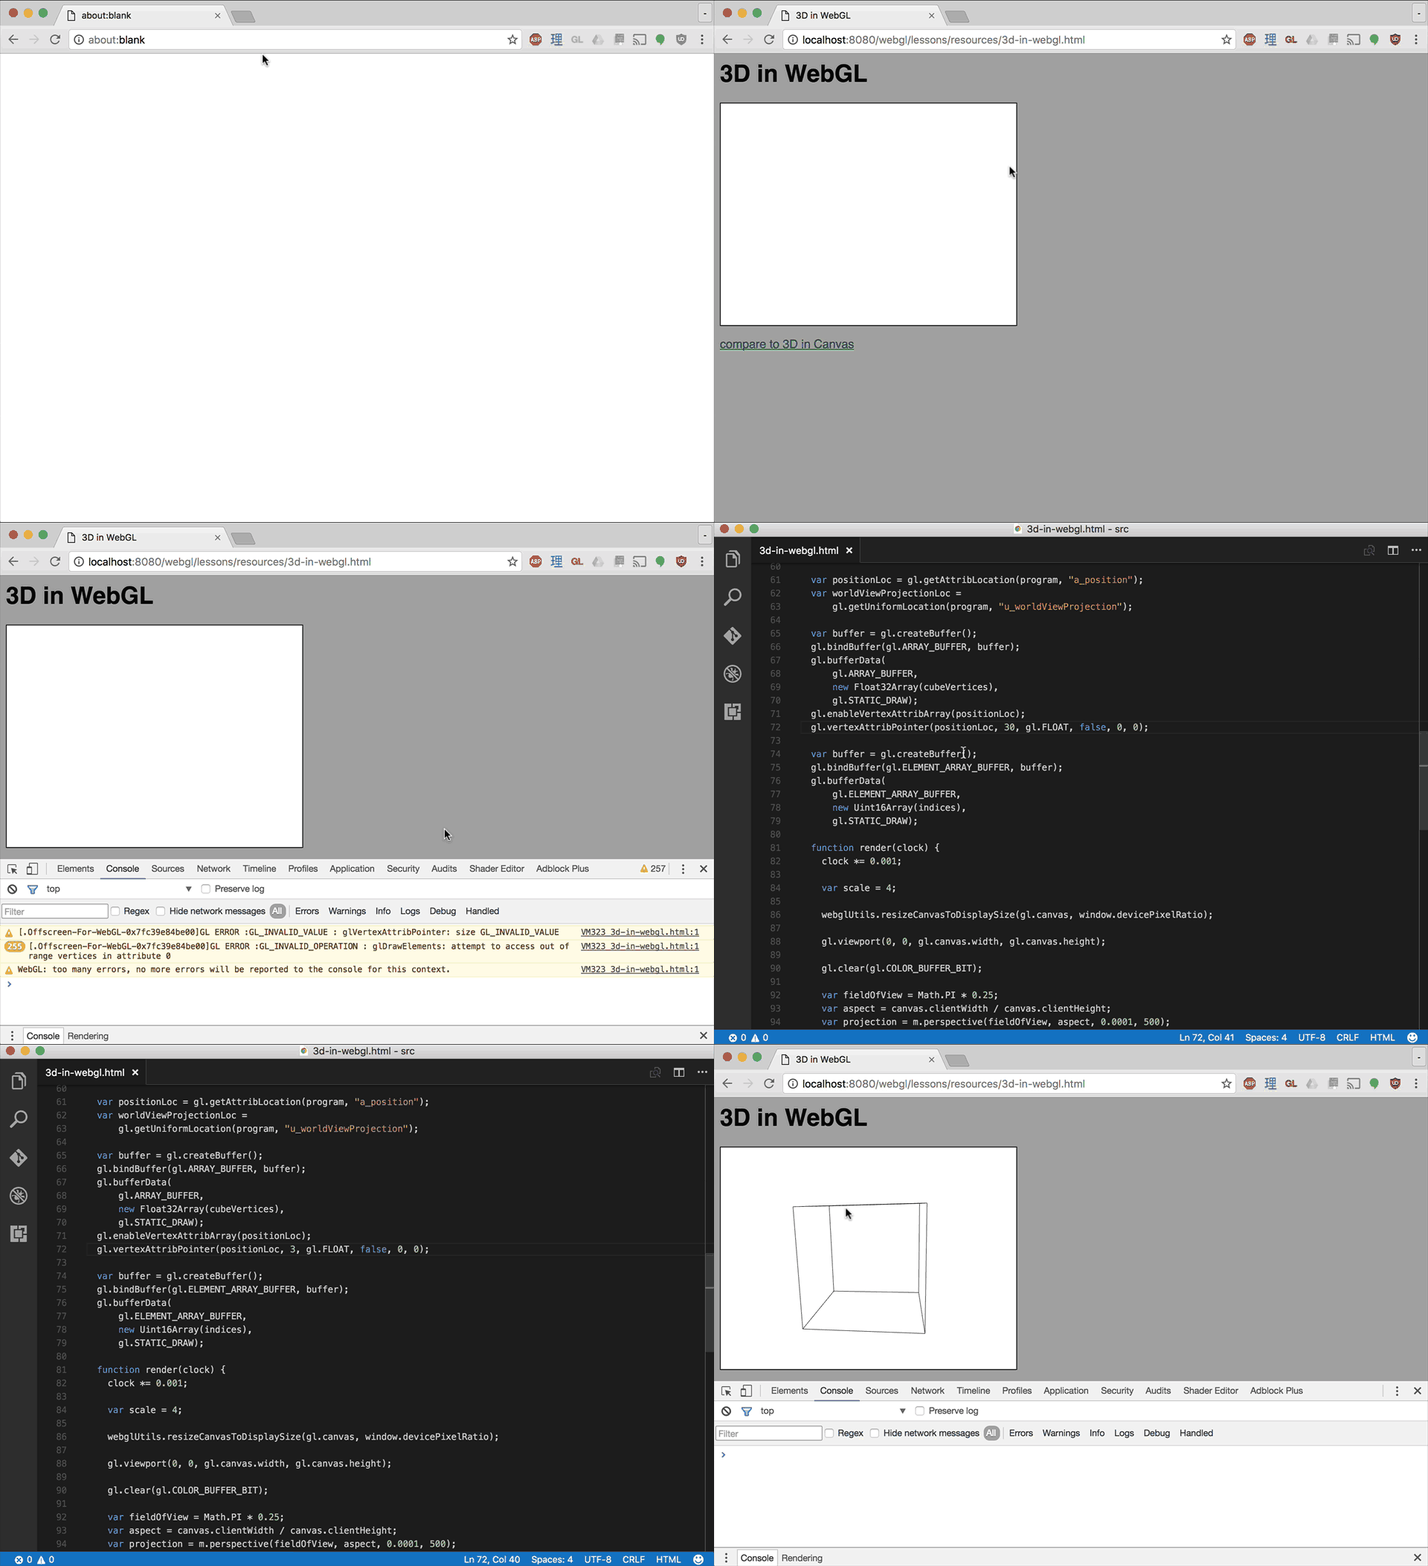
Learn how to use them. If nothing else always check the JavaScript console. If there is an issue it will often have an error message. Read the error message closely and you should get a clue where the issue is.
WebGL Lint
Here is a script to check for several webgl errors. Just add this to your page before your other scripts
<script src="https://greggman.github.io/webgl-lint/webgl-lint.js"></script>
and your program will throw an exception if it gets a WebGL error and if you’re lucky print more info.
You can also add names to your webgl resources (buffer, textures, shaders, programs, …) so that when you get an error message it will include the names of the resources relevant to the error.
Extensions
There are various WebGL Inspectors. Here’s one for Chrome and Firefox.
Note: READ THE DOCS!
The extension version of spector.js captures frames. What this is means is it only
works if your WebGL app successfully initializes itself and then renders in a
requestAnimationFrame loop. You click the “record” button and it captures
all the WebGL API calls for one “frame”.
This means without some work it won’t help you find issues during initialization.
To workaround that there are 2 methods.
-
Use it as a library, not as an extension.
See the docs. This way you can tell it “Capture the WebGL API commands now!”
-
Change your app so that it doesn’t start until you click a button.
This way you can go to the extension and pick “record” and then start your app. If your app doesn’t animate then just add a few fake frames. Example:
<button type="button">start</button>
<canvas id="canvas"></canvas>
function main() {
  // Get A WebGL context
  /** @type {HTMLCanvasElement} */
  const canvas = document.querySelector("#canvas");
  const gl = canvas.getContext("webgl");
  if (!gl) {
    return;
  }

  const startElem = document.querySelector('button');
  startElem.addEventListener('click', start, {once: true});

  function start() {
    // run the initialization in rAF since spector only captures inside rAF events
    requestAnimationFrame(() => {
      // do all the initialization
      init(gl);
    });
    // make so more frames so spector has something to look at.
    requestAnimationFrame(() => {});
    requestAnimationFrame(() => {});
    requestAnimationFrame(() => {});
  }
}

main();
Now you can click “record” in the spector.js extension, then click “start” in your page and spector will record your initialization.
Safari also has a similar built in feature that has similar issues with similar workarounds.
When I use a helper like this I’ll often click on a draw call, and check the uniforms. If I see a bunch of NaN (NaN = Not a Number) then I can usually track down the code that set that uniform and find the bug.
Inspect the Code
Also always remember you can inspect the code. You can usually just pick view source
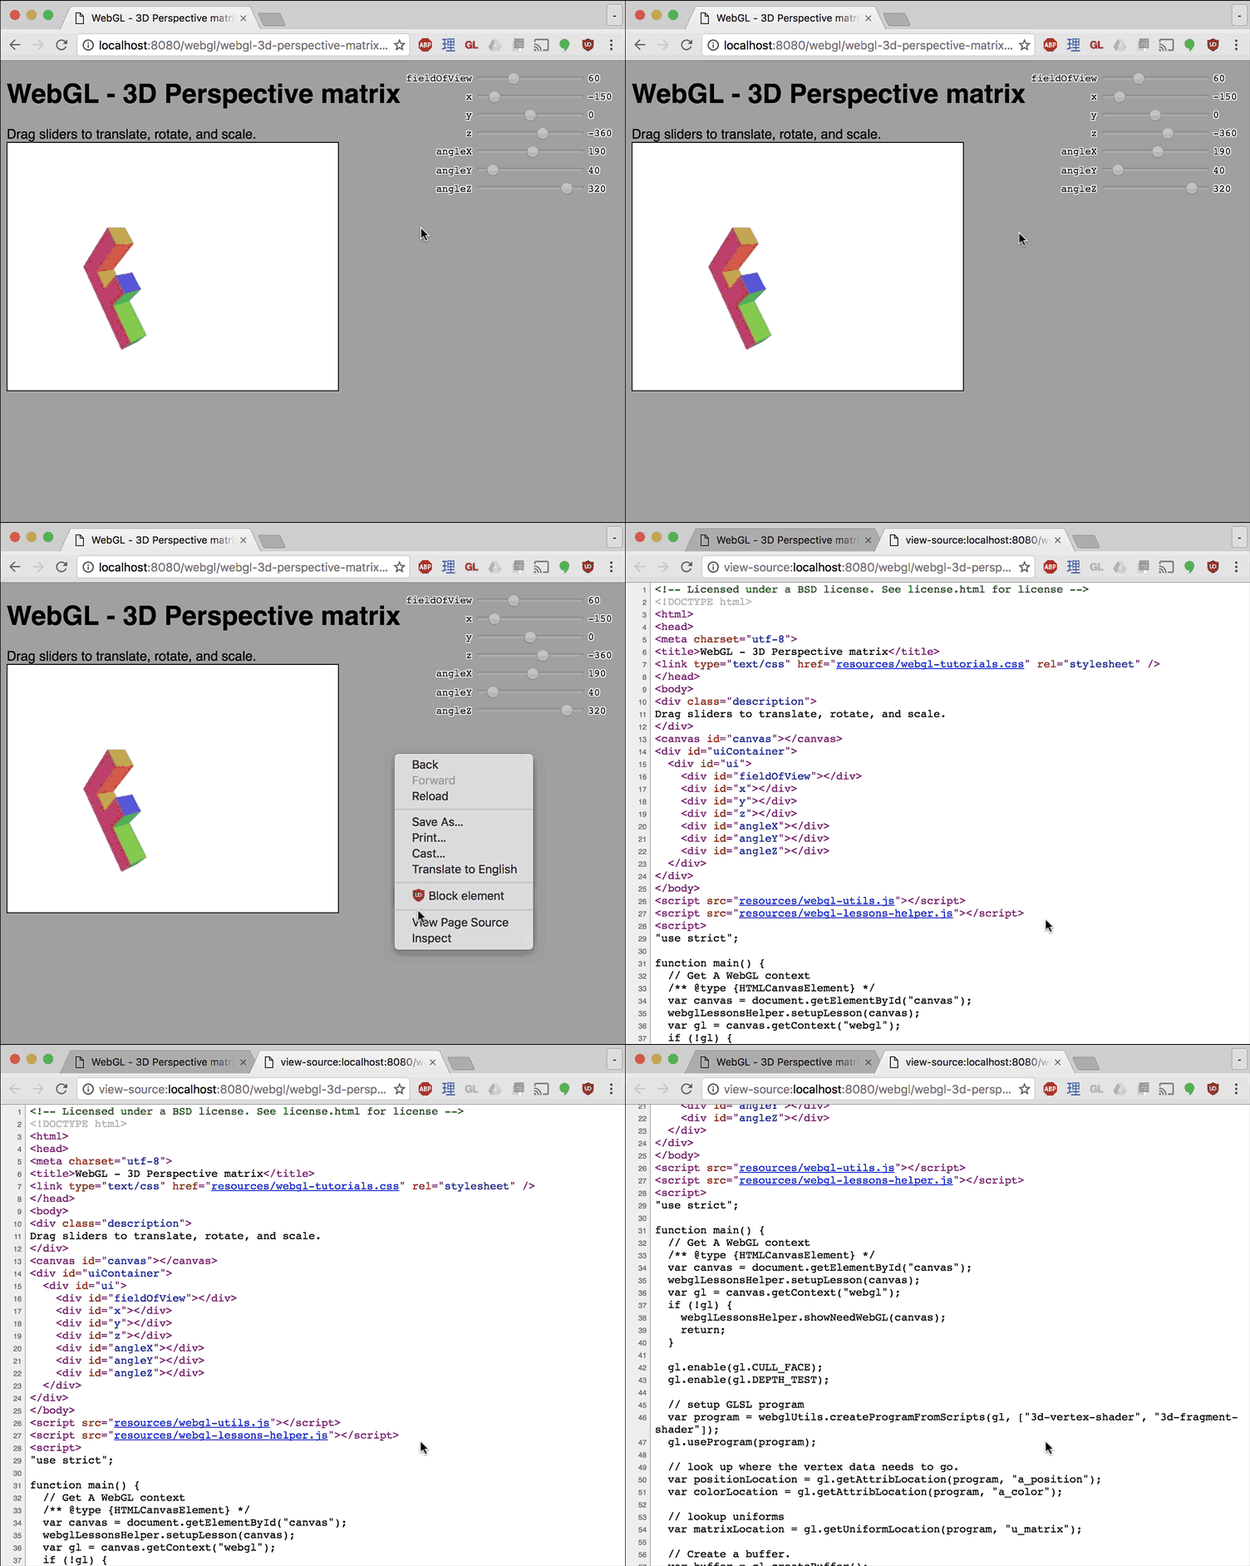
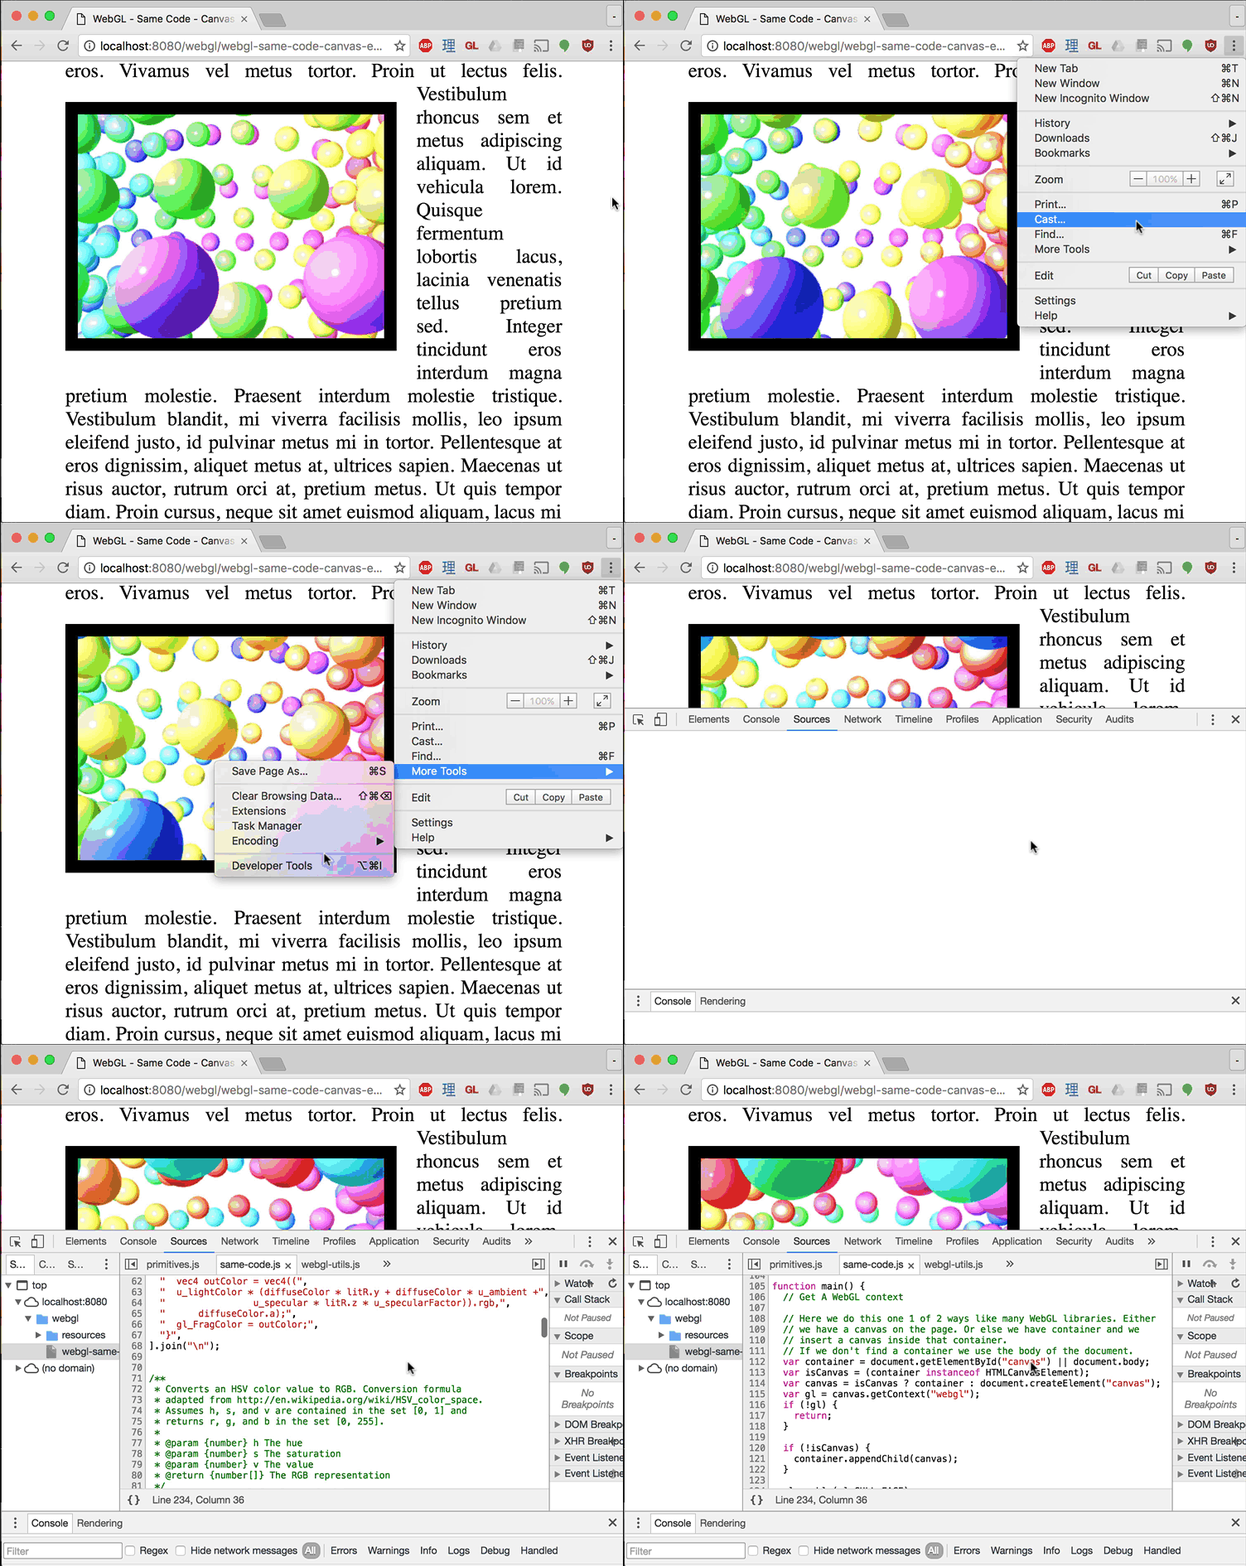
Even if you can’t right click a page or if the source is in a separate file you can always view the source in the devtools
Get Started
Hopefully that helps you get started. Now back to the lessons.